
















Analytics shows how much traffic and revenue AI assistants are sending your store, set against the rest of your traffic. This article explains what it reports, how to connect Google Analytics, and how to read the comparison.
Key stats
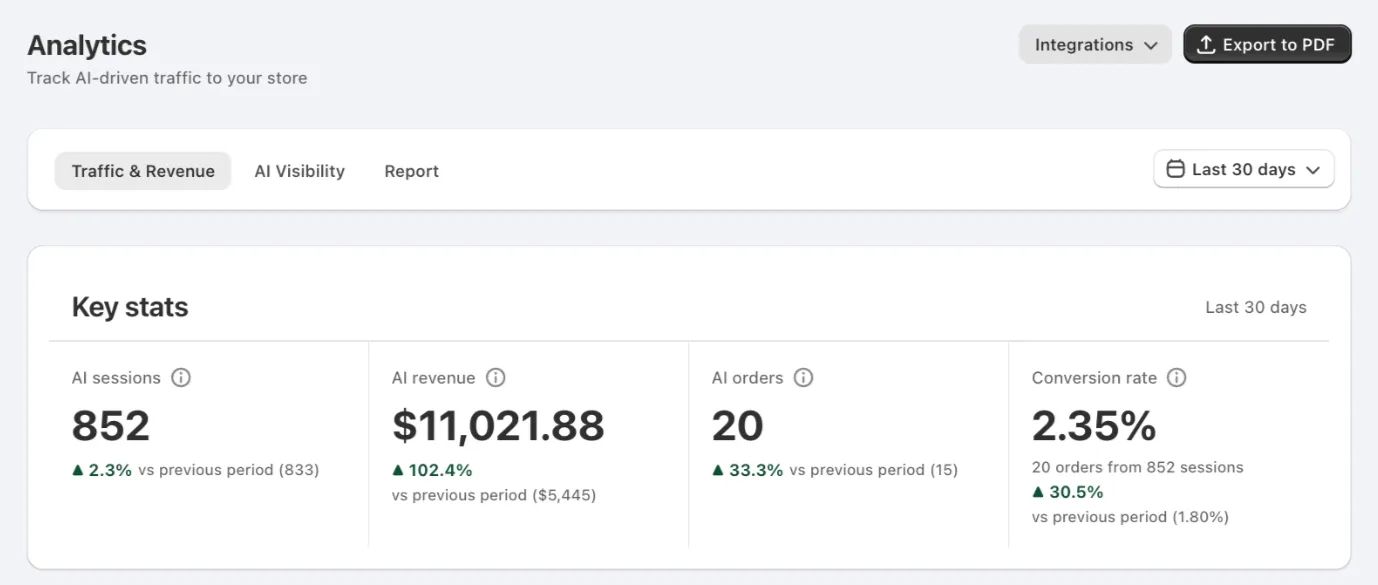
The top of the page answers the commercial question a visibility score cannot: is any of this bringing customers in?
- Total AI Sessions — visitors arriving from AI platforms
- AI-Driven Revenue — revenue from orders placed by visitors who arrived through an AI platform
- AI Traffic Share — how much of your total traffic that represents
- Conversion Rate — AI orders divided by AI sessions for the selected period
Core AI traffic comes from Shopify session referral and UTM data, so these figures do not depend on Google Analytics. Where Shopify's native agentic sales reporting is available, Swap Discovery can use it for AI channel orders and revenue, including supported purchases that do not create a normal website referral.
Some in-AI checkout activity is reported as a total for the period without a daily breakdown. It is included in Key stats but cannot be drawn on the daily charts, so a chart can show less than the Key stats total. When this happens, the chart shows a message explaining the difference.
A dash means Swap Discovery could not retrieve a comparable value; it does not mean the true value is zero.
Use Date Range to set the period. AI sessions and revenue include activity from before you installed Swap Discovery, subject to the reporting history available: revenue figures are limited by how far back your order history reaches, and Analytics tells you the date it starts from.
These figures show identifiable AI-attributed activity. They are not limited to activity since installation, and they are not revenue generated by Swap Discovery. They also do not capture all AI-driven traffic: some visits cannot be identified as coming from AI and may appear as direct or unattributed traffic, so the true amount of AI-influenced activity may be higher than the figures show.
Which assistants are sending traffic
AI Referrer Traffic over time charts daily human visitors arriving from AI platforms, broken out by platform: ChatGPT, Claude, Perplexity, Gemini, Copilot and Grok. Traffic by Platform gives the same split as a share, and Traffic by Day of Week shows when those visitors arrive.
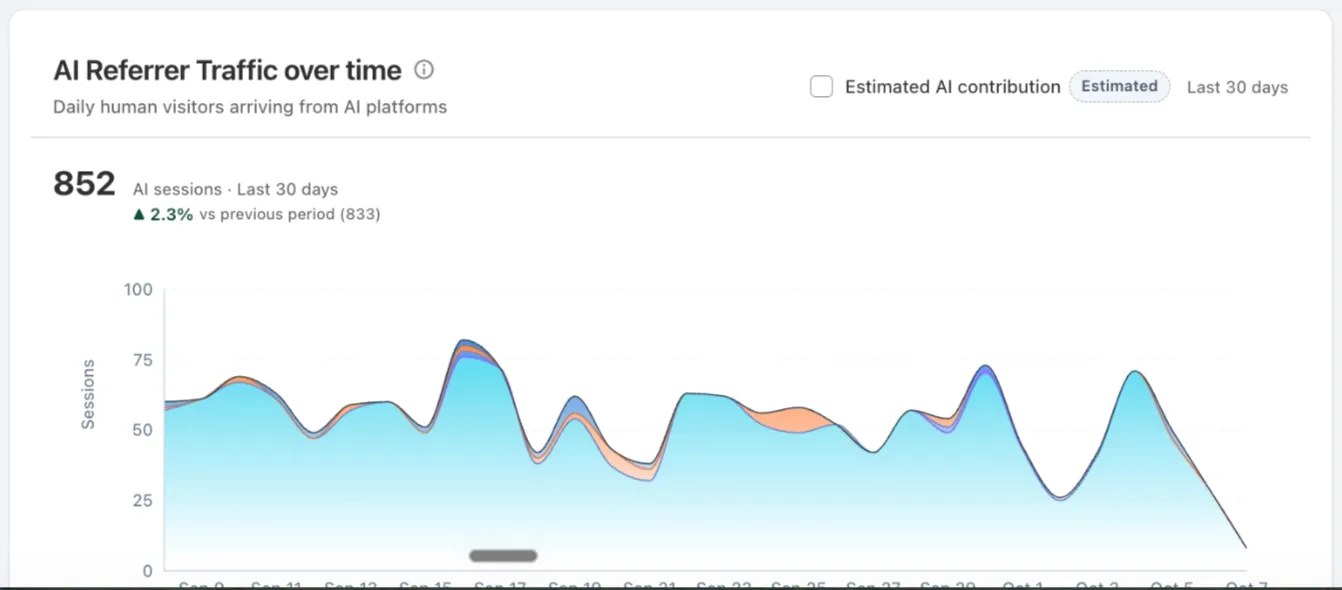
AI channel traffic data typically takes 24 to 48 hours to appear, so a new store or a quiet day will show nothing rather than a zero line.
Revenue
AI Revenue over time charts daily revenue attributed to AI-driven traffic. Revenue appears once orders from AI-referred visitors have been processed and synced, so it lags sessions.
Share of voice over time
AI Share of Voice Over Time builds a progress timeline from your AI Visibility Score across successive automatic runs, so you can see whether your visibility is improving rather than reading a single snapshot.
This one depends on autopilot being active. If it is not, the card tells you so and offers to switch tracking on.
The score it tracks is the one explained in Understanding AI Visibility in Swap Discovery.
Landing pages
Top 10 AI Landing Pages shows which of your pages AI-referred visitors actually arrive on. This is often more useful than the totals, because it tells you which content is being cited.
It depends on AI platforms linking to your pages with UTM tracking, so it fills in more slowly than the other cards.
Connecting Google Analytics
Google Analytics 4 is optional. Analytics works from your Shopify data without it. Connecting GA4 adds GA4-confirmed AI traffic and revenue, and unlocks the full product-level funnel — carts, orders, conversion and revenue by product — where that feature is included in your plan. Without GA4, product performance shows visits only.
To connect it:
- Go to Brand Settings → Integrations → Google Analytics. You can also start from Connect Google Analytics at the top of Analytics.
- Start the connection, then sign in to Google in the new tab and grant read access.
- Return to Swap Discovery. The integration page updates automatically.
- Select your store's GA4 property.
- Click Save.
The connection is read-only: Swap Discovery reads from your property and does not write to it or change your reporting. GA4 data refreshes once a day, and Pull now on the integration page starts an on-demand refresh.
You can connect it at any point — it is not part of setup. Getting started with Swap Discovery covers what is.
Exporting
CSV export is available on every plan. Export to PDF starts at Growth and produces a copy of the page, which is the practical way to circulate results to people who do not use Swap Discovery directly.
What your plan includes
CSV export is available on every plan. PDF export, advanced analytics, Top 10 AI Landing Pages, share-of-voice metrics and the AI revenue chart start at Growth. If a card is locked, it is not included in your current plan, and the upgrade message names the plan that includes it.